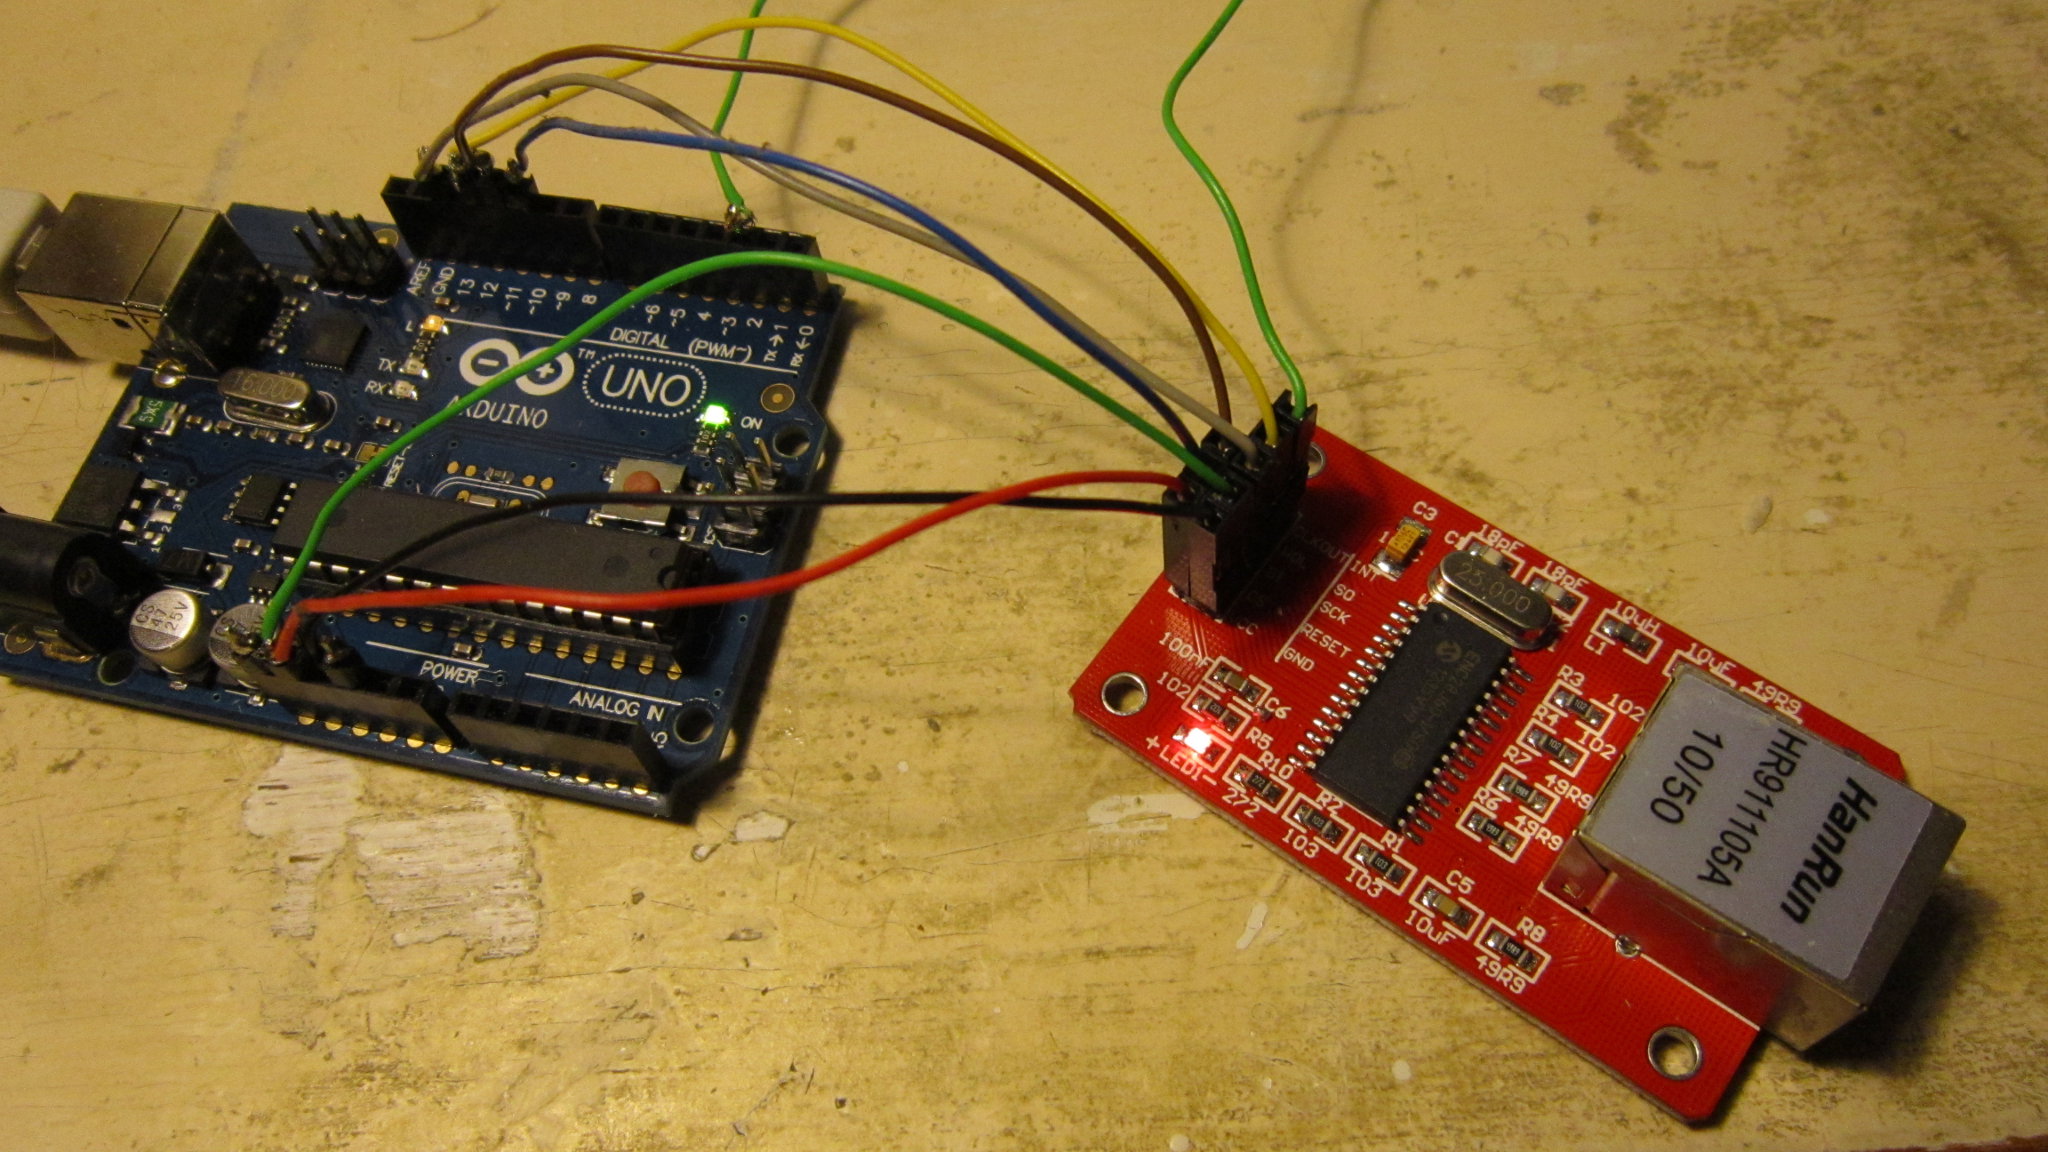
I am using an arduino uno, an ENC28J60 ethernet module and a few DS 18B20 temperature sensors. Presently, it seems to be possible to connect up to 7 sensors (although I have only tested with 3) by optimizing the code a bit for memory usage, it should be possible to add some more sensors. It should not be too hard to reuse much of this to use DHT11 or DHT22 sensors, but as far as I have understood, it is not possible to run more of those on one bus.
The temperatures may be read out in a browser or sent of as a json-string. The json-string also includes the sensors ids and a millisecond time stamp.
E.g.:{"temp":[23.00,23.50,-4.00],"address":["2852932640040","28A9D0264006D","2895D76E40050"],"millis":526288}
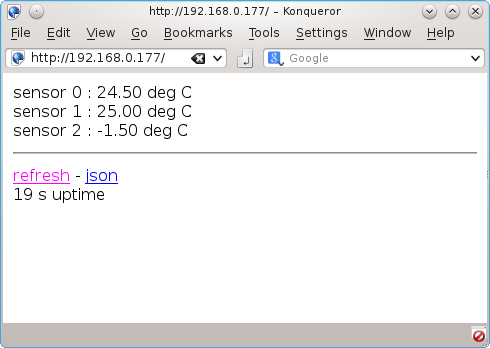
The web page as served from the arduino is pretty simple, Sensor 0 and 1 are measuring temperatures directly at my working desk, sensor 2 is just outside the window.
This is just a small part of what I hope will grow up to be a house monitoring system, adding on, among other things, devices for energy usage monitoring. I am planning to store the information in an sql database, but for the first stage testing, I am polling the server and storing the results in a couchdb.
The sketch can be found here:
Version 1.0 2nd feb 2013 or at github. It runs well on an arduino uno, but it is close to the limit of RAM usage. Just by adding a bit more text-output, the sketch will hang. If you want to add something, look through the sketch and see what can be removed (I have some serial debug logging and depending on the needs, it may be possible to remove either the part that serves html or the part that serves json.)
If using a newer ide than v 1.0, have a look at my description how to use the ENC 28J60.
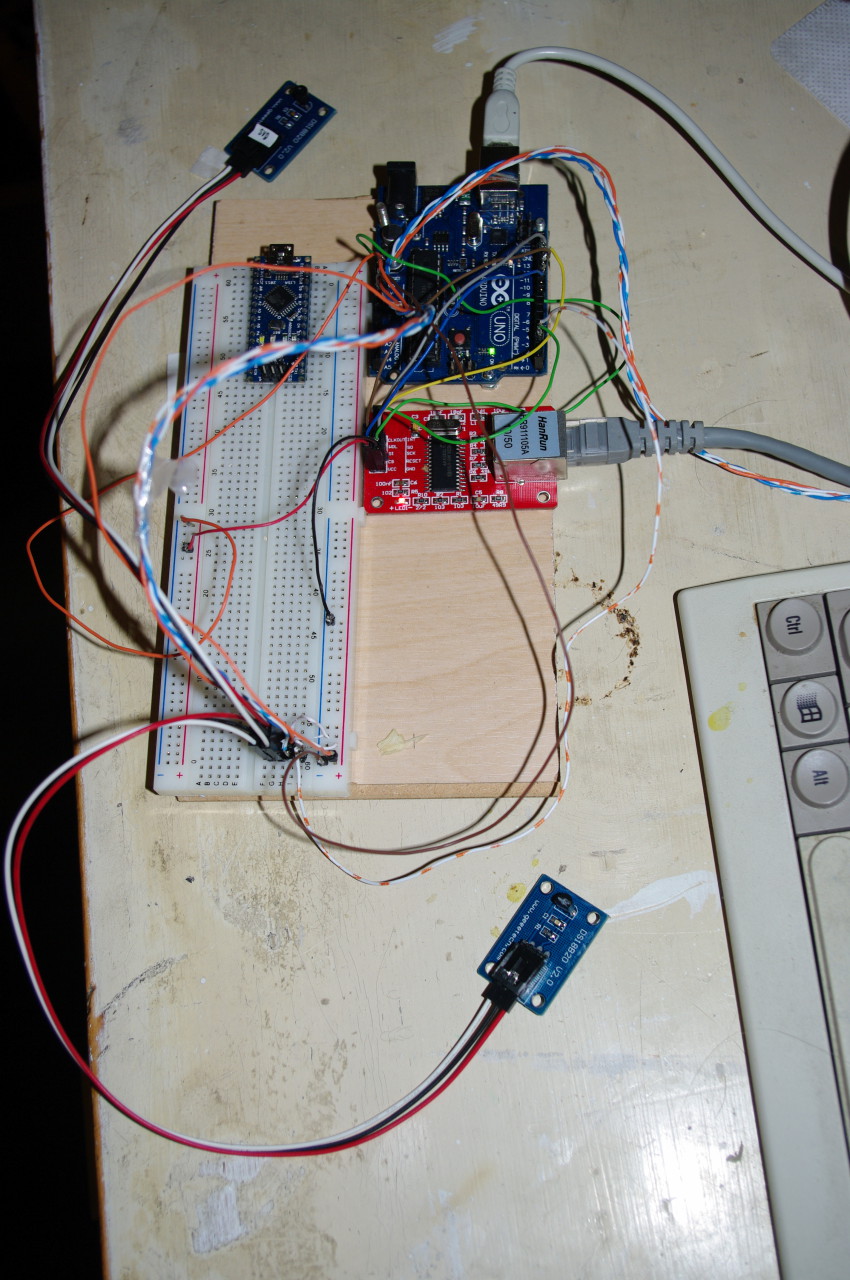
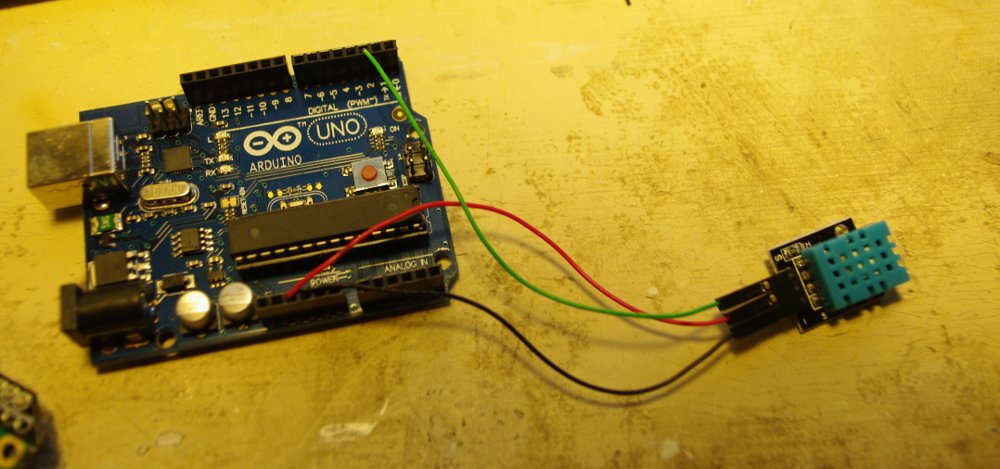
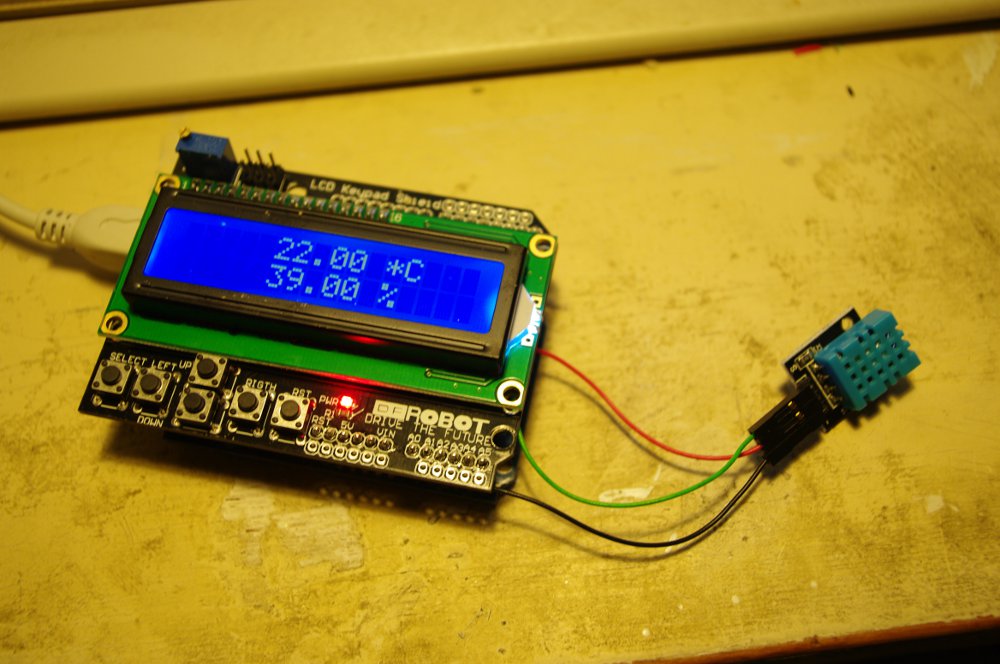
Two of the 18B20s can be seen. The gutted tp-cable runs to an outdoor one. (The Arduini Nano at the back end of the bread board is not in use in this project)
The data may also be forwarded to cosm (formerly known as Pachube). To get the data into the right format, make cosm call the cosm_uploader that further back talks to the arduino. (cosm_uploader at github).

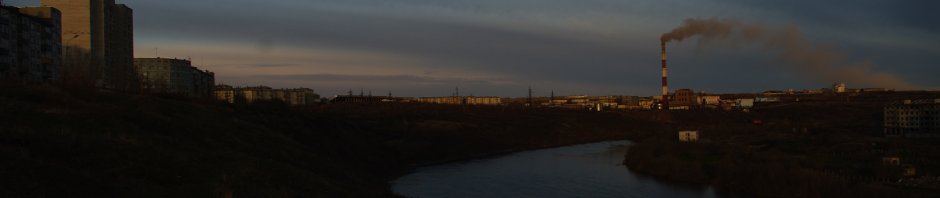
The last five days outdoor temperatures at my place (More data can bee seen at feed 102668.)


You must be logged in to post a comment.