Utrolig mange epler, mye smått, så jeg var først bekymret for at det skulle være større andel kjernehus og skall så dårligere utbytte, men det er helt på det normale:
13. september: Presset 48 kg, hovedsakelig james grieve, noe aroma og torsten, 24 liter 27. september: presset 48 kg, praktisk talt bare james grieve, 25 liter 28. september; hentet epler hos naboene, 60-70 kg matepler i nr4, ca like mye gravensten på Høyenhall. Presset. 48 kg gravensten til 24 liter most 4. oktober: Presset 20 kg gravensten med 28 kg egne epler, hovedsakelig james grieve, 24 liter most 5. oktober: Presset 48 kg matepler fra nr 4, 24 liter most 26. oktober: Presset 44 kg, mest div grønne ‘pæreepler’ fra Høyenhall samt 4 kg torstein. Dobbeltpresset til 25 liter. 12 liter på juiceposer, resten til cider. 30. oktober: Avsluttet, Presset 48 kg torstein fra Høyenhall, 25 liter juice
Totalt 336 kg epler som har blitt til 171 liter juice, hvorav 38 liter blir til cider. Ville spart litt tid og fått et par liter til for hver av de fem første rundene om jeg hadde dobbeltpresset da også. (Dobbeltpressing, ta ut resten fra pakkepressen og kjør en runde i den lille tønnepressen.)
The system for adjusting the height of the saw blade on a Electra Beckum / Metabo PKF255 is made by a steel bolt, the feed spindle, pulling a brass nut, the draw bolt. I have also been told that the PKF300 is using the same mechanism, so this description should aso be useabe for this model.
The use of a steel bolt and a brass nut means that if the mechanism gets stuck and one still tries to adjust the height, the feed spindle will ultimately destroy the draw bolt. If the draw bolt also was steel, it would be more difficult to damage, but the system could get stuck and be very difficult to dismantle or the feed spindle could be destroyed.
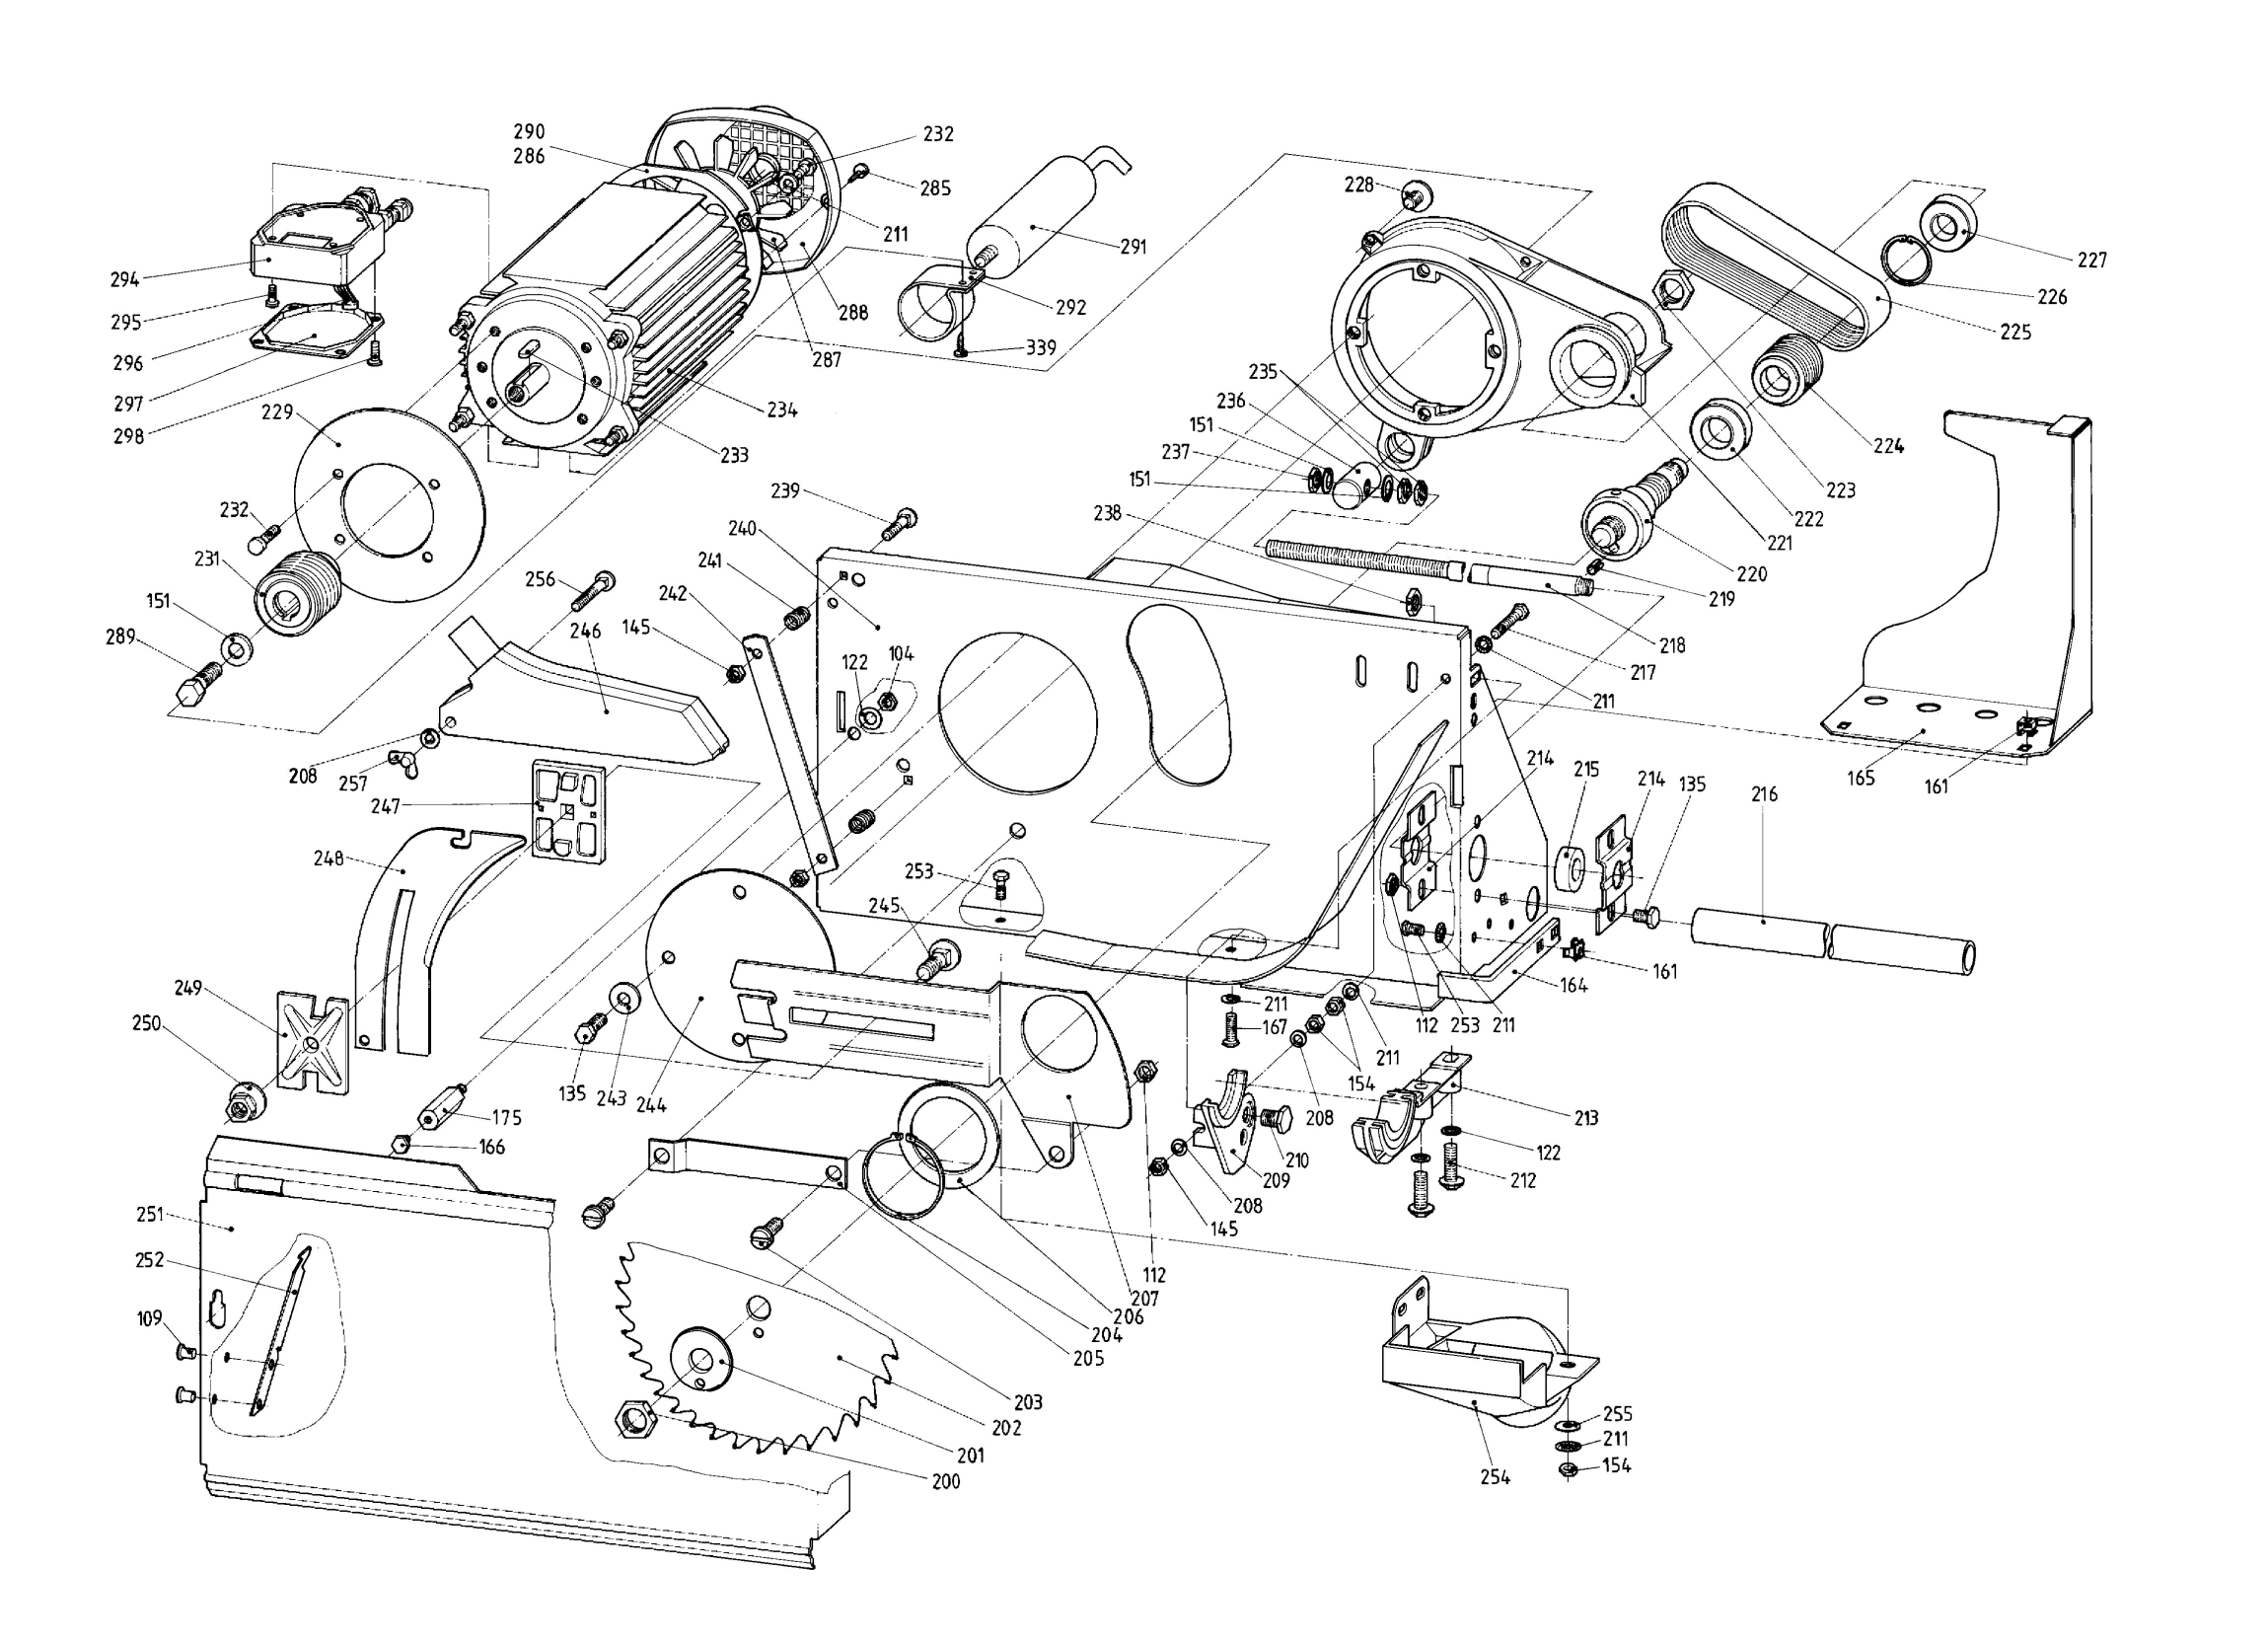
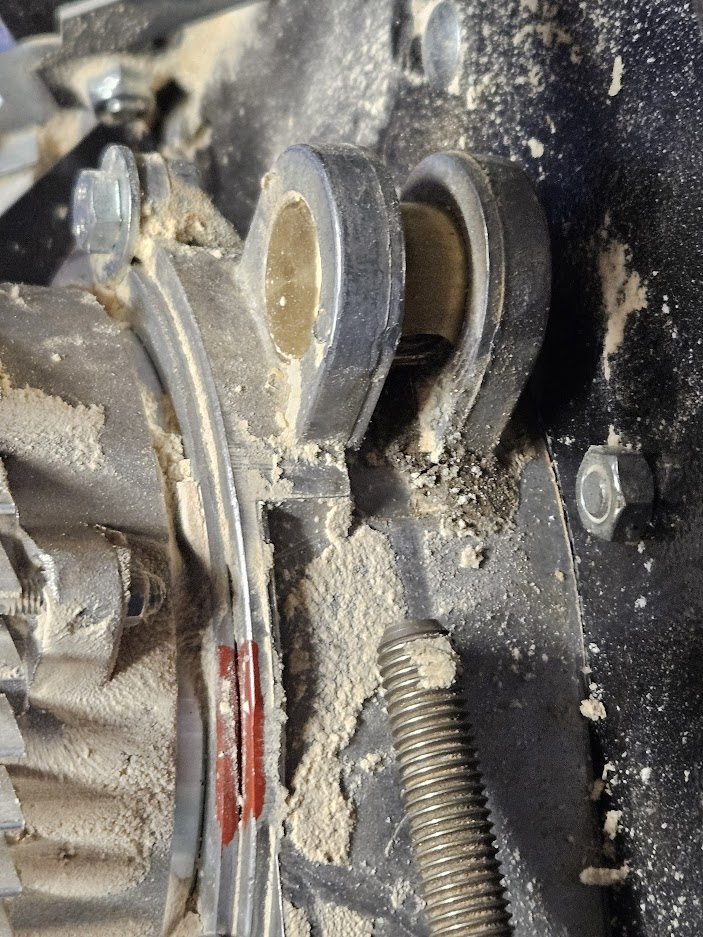
The part to be replaced is the one marked as “236” in the image below (towards the top rigth). All numbers in quotes in this article refers to that image.
I found a new draw bolt at WMV-Dresden Ersatzteil-Shop, but it should not be too difficult to make it from a 25mm ø brass rod by drilling a hole to make M12 tread. I had to use the spare part list at powertoolspares.com to identify the part numbers. Although, at that shop, the part was not available. The part numbers are also listed in the part manual that should have been delivered with the saw.
The first step is to take the upper part of the saw off the base. It is fastened by 4 screws, one in each corner. They can be reached through the “doors” on the front- and backside of the base. When it is loosened, lift the upper part and put it upside down on the base. Just for warning, it is not possible to get where it is needed to do this repair by removing the top plate of the saw, I first thought that would be the way…
When the underside is available, the first ting to remove is the cover seen on the right of the drawing marked “165”. It is fastend using two screws with nuts fastened in the cover. With this cover removed, the components for height adjustmets are clearly visible.
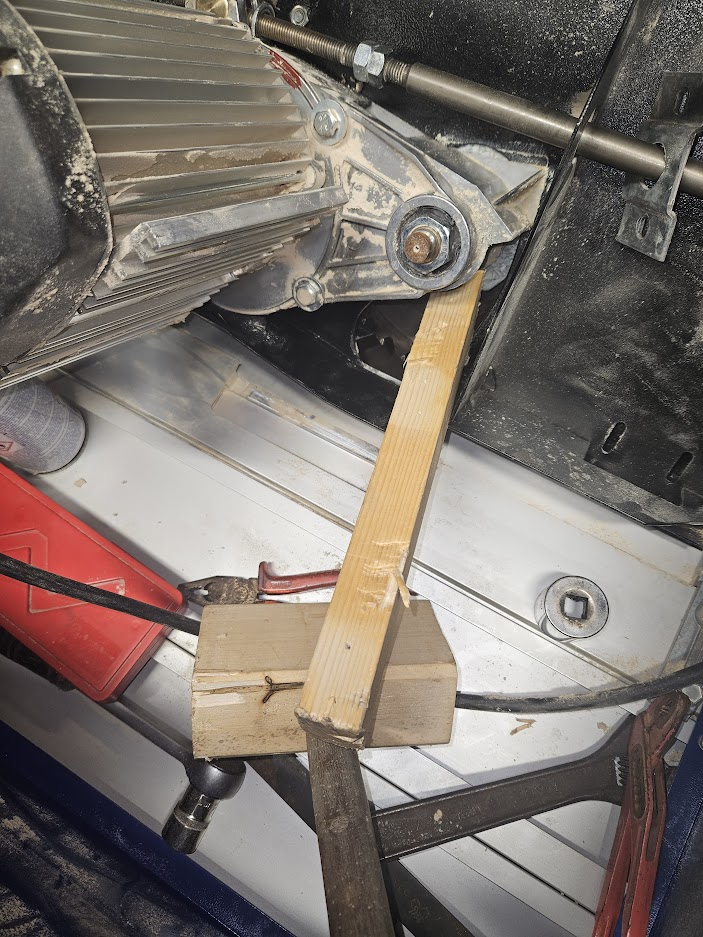
To be able to remove the pull bolt, the feed spindle “218” must be completely withdrawn from it. This may be easier to do if the saw is in the lowest possition. The height can be adjusted up by using a piece of wood wedged towards an edge on the chip case as seen in the photo. To adjust it down, use a wood mallet just on the other side of where the piece of wood is pushing.
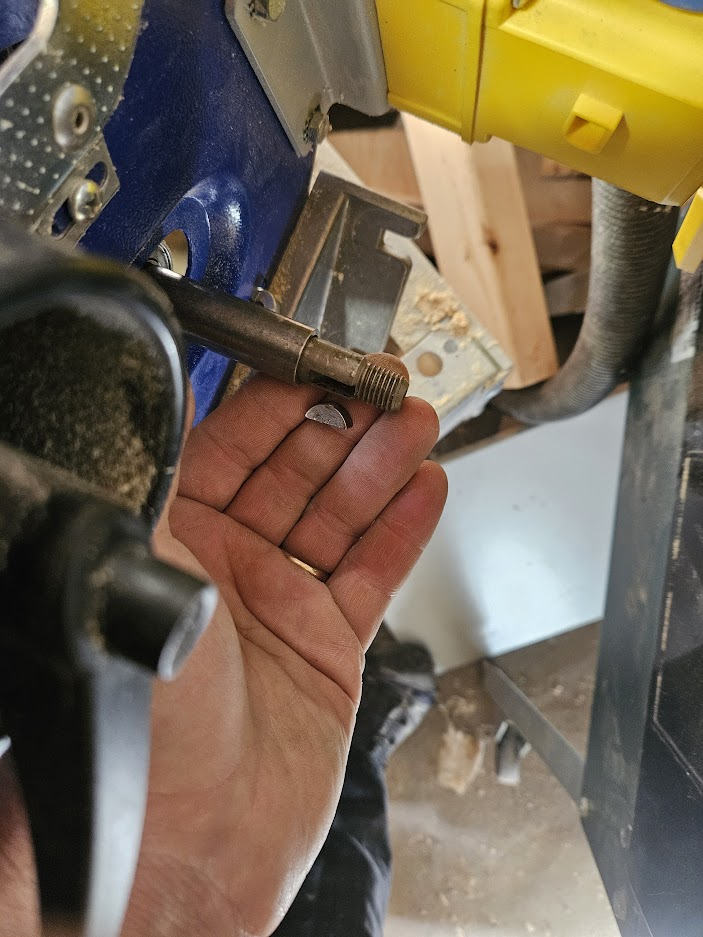
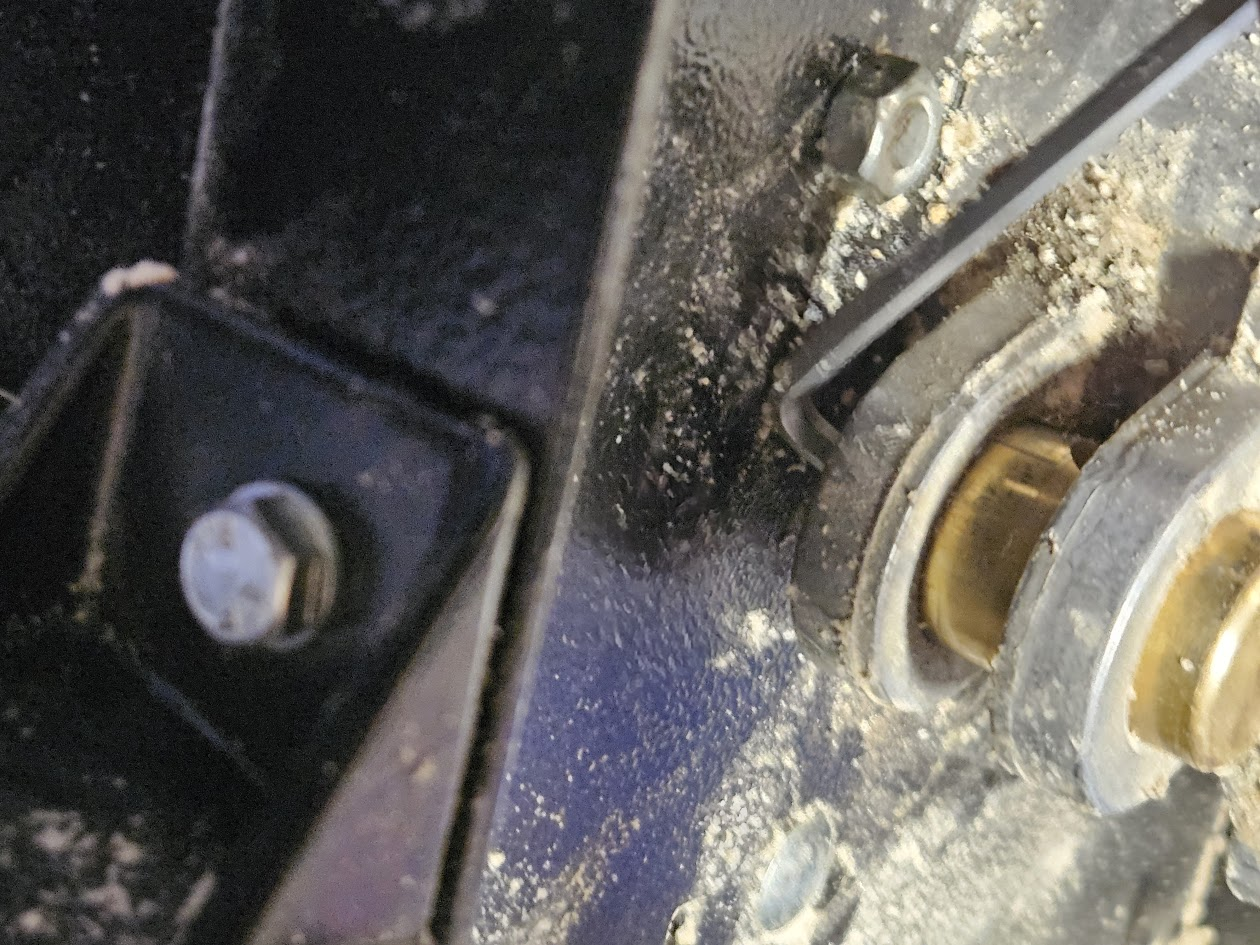
Remove the nut from the inner end of the feed spindle. Thereafter, loosen the two brackes “214” fastening the bearing on the feed spindle to the chip case. Then it is time to remove the handle. Remove the nut and then yank the handle off. It is just pushed onto the spindle. If it does not move, try to wedge it off with a piece of wood. When the handle is off, the small part locking it onto the spindle must be removed, the half moon shaped part seen in the photo.
This part is just fitting very snugly into the spindle, so it can be pulled out with a pair of pliers. Then the tube on the spindle holding the bearing in place is easy to take out.
To remove the bearing, the outer bracket needs to be removed. To do this, screw the spindle so far into the drawbolt that the bracket can be removed inside the casing.
Again, the bearing is sitting tight on the spindle, but it can be removed by the help of a wooden mallet. It is sitting on a “step” on the spindle where it fits tight, when it is pushed its own length towards the handle end, it can easily be removed. Again, the spindle has to be screwed so far into the pull bolt that the bearing fits between the end of the spindle and the inside of the casing.
With the bearing removed, the spindle can be removed completely from the draw bolt.
The draw bolt is also fitting wery tight, I found a hex key to be usable as a wedge to get it out.
An important step now will be to rinse and lubricate the suspention for the saw so that the load on the new draw bolt will be less. Also, as soon as the height adjustment starts to become difficult, it should be rinsed and lubricated to avoid the draw bolt to be damaged again. I sprayed in some wd40 between the flange and the chip case and dried off whatever came out, I am still not sure if this is the right stuff to use, but the mechanism is moving a lot easier than what it used to do.
Notes from the reassembly
The drawbolt it self fits really tight. I had again to use the mallet to get it in. When it was in, it was difficult to turn it to have the right angle to engage with the spindle drive. I had to use a long M12 bolt to turn it into the right position, seeing that the bolt was parallell to the spindle.
The “halfmoon” that is locking the handle onto the spindle is also a really tight fit After trying to get it into its space in the spindle, I left it in the freezer overnight to make it shrink a little bit for a better fit, but having to use a tweezer to handle it, I lost it on the floor and it (has so far) disappeared. I cut out a coarce piece of some 5mm aluminium I had and it seems to do the job so far.
The most important observation: I bought the saw used with a broken drawbolt, so the first thing I did was to change it, afterwards, I was always annoied over how difficult it was to adjust the height. After lubricating the moveable parts in the height adjustment system, it runs very smoothly and easily. Next time it starts to go harder again, I will hopefully remember to rinse and lubricate it before the drawbolt is damaged…
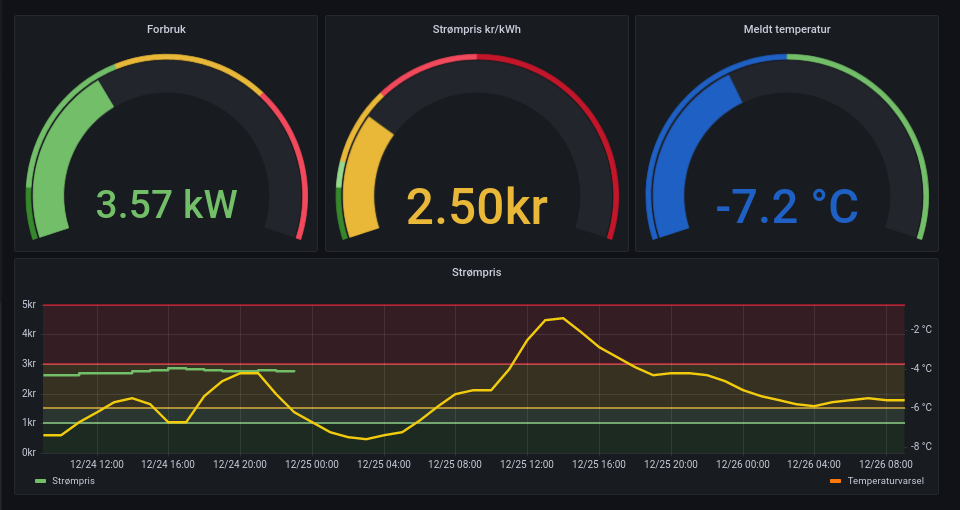
Jeg skaffet en Tibber Pulse som jeg koblet opp i sikringsskapet. Den måler strømforbruket hvert 2.5 sekunder og jeg kan få tak i de dataene. Jeg kan holdeøye med forbruket og også se dette sammen med fremtidig strømpris og temperatur. Jeg seteter opp et dashboard i Grafana. Serversystemene kjøres på en linux server jeg har gående. Nøyaktig det samme oppsettet skal kunne kjøres på de fleste nyere linux systemer som bruker systemd (inkludert rasbian på rasberry pi). Dersom du bruker et system som ikke har systemd, vil alt fungere med unntak av oppsettet for autostart. For å hente inn værvarsel,se http://sickel.net/blogg/?p=1923.
Inntil videre tar jeg omveien via Tibbers skyløsning. PyTibber gir et oppsett som gjør dette enkelt. Da kan data hentes inn enkelt etter et “pip install tibber”:
#!/usr/bin/python3

import asyncio
import aiohttp
import tibber
import json

ACCESS_TOKEN = "Tibber access token"
FILE='/var/www/html/homelog2/pulse.json'
# Can be picked up by my webserver

async def _callback(pkg):
    data = pkg.get("data")
    if data is None:
        return
    pulsedata=data.get("liveMeasurement")
    with open(FILE,'w') as outfile:
        json.dump(pulsedata,outfile)


async def run():
    async with aiohttp.ClientSession() as session:
        tibber_connection = tibber.Tibber(ACCESS_TOKEN, websession=session)
        await tibber_connection.update_info()
    home = tibber_connection.get_homes()[0]
    await home.rt_subscribe(_callback)

if __name__ == '__main__':
    loop = asyncio.get_event_loop()
    asyncio.ensure_future(run())
    loop.run_forever()
Dette scriptet henter data fortløpende og lagrer det som en json fil i en katalog som serves av en http-server. Jeg ønsker at dette skal kjøre kontinuerlig og starte automatisk om serveren starter om, så jeg har kopiert pythonscriptet til /usr/local/bin og definert en service-fil:
Dette er lagret som /etc/systemd/system/tibberpulse.service. For å få dette til å kjøre, må man fortelle systemd at det finnes nye service-filer, så starte servicen og til slutt sette at den skal startes med reboot. Dette er følgende kommandoer:
morten@sjest:~(master)$ systemctl status tibberpulse.service
● tibberpulse.service - Tibber pulse collector
     Loaded: loaded (/etc/systemd/system/tibberpulse.service; enabled; vendor preset: enabled)
     Active: active (running) since Sat 2021-12-18 17:27:59 CET; 5 days ago
   Main PID: 120163 (tibberpulse.py)
      Tasks: 2 (limit: 19086)
     Memory: 28.3M
        CPU: 6min 24.729s
     CGroup: /system.slice/tibberpulse.service
             └─120163 /usr/bin/python3 /usr/local/bin/tibberpulse.py

Dec 22 18:02:10 sjest tibberpulse.py[120163]:   File "/home/morten/.local/lib/python3.9/site-packages/graphql_subsc>
Dec 22 18:02:10 sjest tibberpulse.py[120163]:     msg = await asyncio.wait_for(self.websocket.recv(), timeout=30)
Dec 22 18:02:10 sjest tibberpulse.py[120163]:   File "/usr/lib/python3.9/asyncio/tasks.py", line 481, in wait_for
Dec 22 18:02:10 sjest tibberpulse.py[120163]:     return fut.result()
Dec 22 18:02:10 sjest tibberpulse.py[120163]:   File "/home/morten/.local/lib/python3.9/site-packages/websockets/le>
Dec 22 18:02:10 sjest tibberpulse.py[120163]:     await self.ensure_open()
Dec 22 18:02:10 sjest tibberpulse.py[120163]:   File "/home/morten/.local/lib/python3.9/site-packages/websockets/le>
Dec 22 18:02:10 sjest tibberpulse.py[120163]:     raise self.connection_closed_exc()
Dec 22 18:02:10 sjest tibberpulse.py[120163]: websockets.exceptions.ConnectionClosedError: no close frame received >
Dec 23 00:08:01 sjest tibberpulse.py[120163]: No data, reconnecting.
Den har feilet noen ganger, men har blitt startet opp igjen og har kjørt uten problemer i halvannet døgn. (Feilen 22 skyldes sannsynligvis at jeg koblet om en nettverkskabel, den burde vært håndtert med en try – except)
Jeg vil også ha inn data om nåværend og fremtidig strømpris. For å gjøre ting enkelt, henter jeg inn dette en gang i timen med crontab (fyll inn egen Tibber-token):
1 * * * * /usr/bin/curl -H "Authorization: Bearer Tibber-token" -H "Content-Type: application/json" -X POST -d '{"query":"{ viewer { homes { currentSubscription{ priceInfo{ current{ total energy tax startsAt } today { total energy tax startsAt } tomorrow { total energy tax startsAt } } } } } }"}' https://api.tibber.com/v1-beta/gql > /var/www/html/homelog2/cost.json
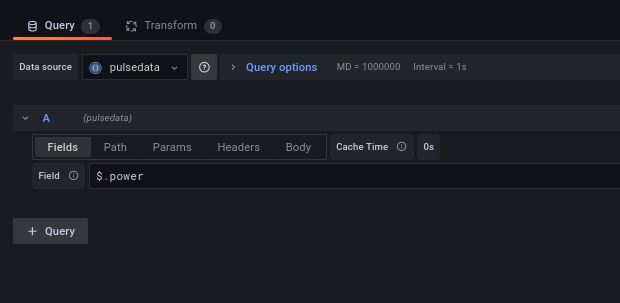
I grafana lager jeg tre datakilder basert på JSON-API som henter inn pulse.json, cost.json og weather.json fra webserveren min. For viserinstrumenetene, er det bare spørring etter et parameter,som eksempel for aktult effekttrekk:
De to andre blir litt mer kompliserte, for aktuell strømpris er Field $.data.viewer.homes[*].currentSubscription.priceInfo.current.total
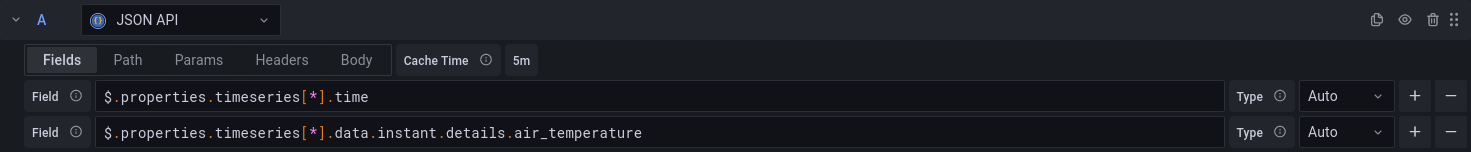
og for temperatur er det $.properties.timeseries[*].data.instant.details.air_temperature
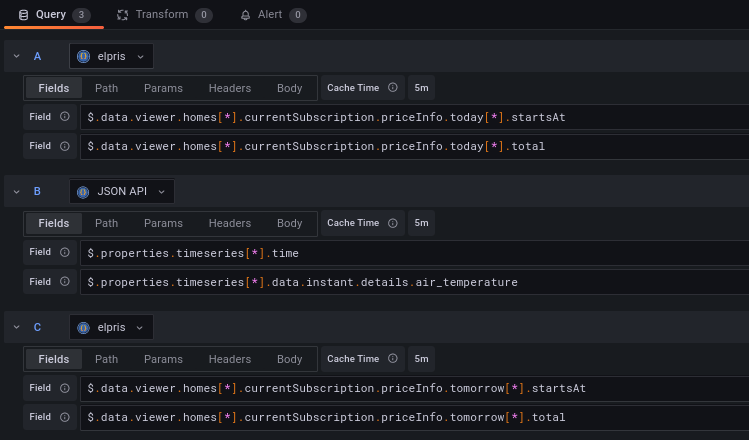
For tidsserien må jeg både hente inn tidspunkt og verdi:
Den øverste henter (resten av) dagens strømpriser, den midterste henter temperaturvarsel (JSON API er et navn jeg satt på datakilden før jeg forsto hvordan den navningen fungerer. Hadde jeg satt det opp nå, ville den hett “metdata”). Den siste henter morgendagens strømpriser.
Plutselig måtte man holde øye med strømprisene og tenke litt på hva man gjør når. Dersom man har en strømleverandør som tilbyr et API for strømforbruk og strømpriser, slik som tibber gir det en del muligheter.
I tibbers api er det blant annet mulig å hente strømforbruke og strømpriser for lang tid tilbake og strømpriser for inneværende og kommende dag. (Sistnevnte når den er satt). Når man har hentet en API-token, kan strømprisene kan hentes ned:
/usr/bin/curl -H "Authorization: Bearer <min token>" -H "Content-Type: application/json" -X POST -d '{"query":"{ viewer { homes { currentSubscription{ priceInfo{ current{ total energy tax startsAt } today { total energy tax startsAt } tomorrow { total energy tax startsAt } } } } } }"}' https://api.tibber.com/v1-beta/gql > /var/www/html/temp/cost.json
Jeg kjører dette fra cron med passende intervall og lagrer datasettet til en katalog som en webserver har tilgang til, så bruker jeg grafana til å presentere data:
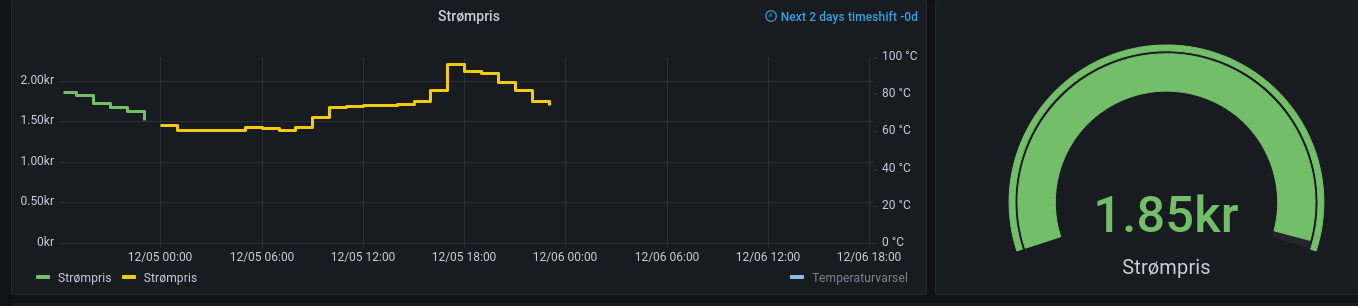
Dette viser nåværende strømpris (1.85 / kWh) og forventet utvikling for inneværende og neste dag
For å hente dette inn i grafana, må jeg først lage en datakilde. Jeg bruker JSON API datakilden. Denne setter jeg opp så webserveren henter inn jsonfilen jeg lagret. (http://<webserver>/temp/cost.json).
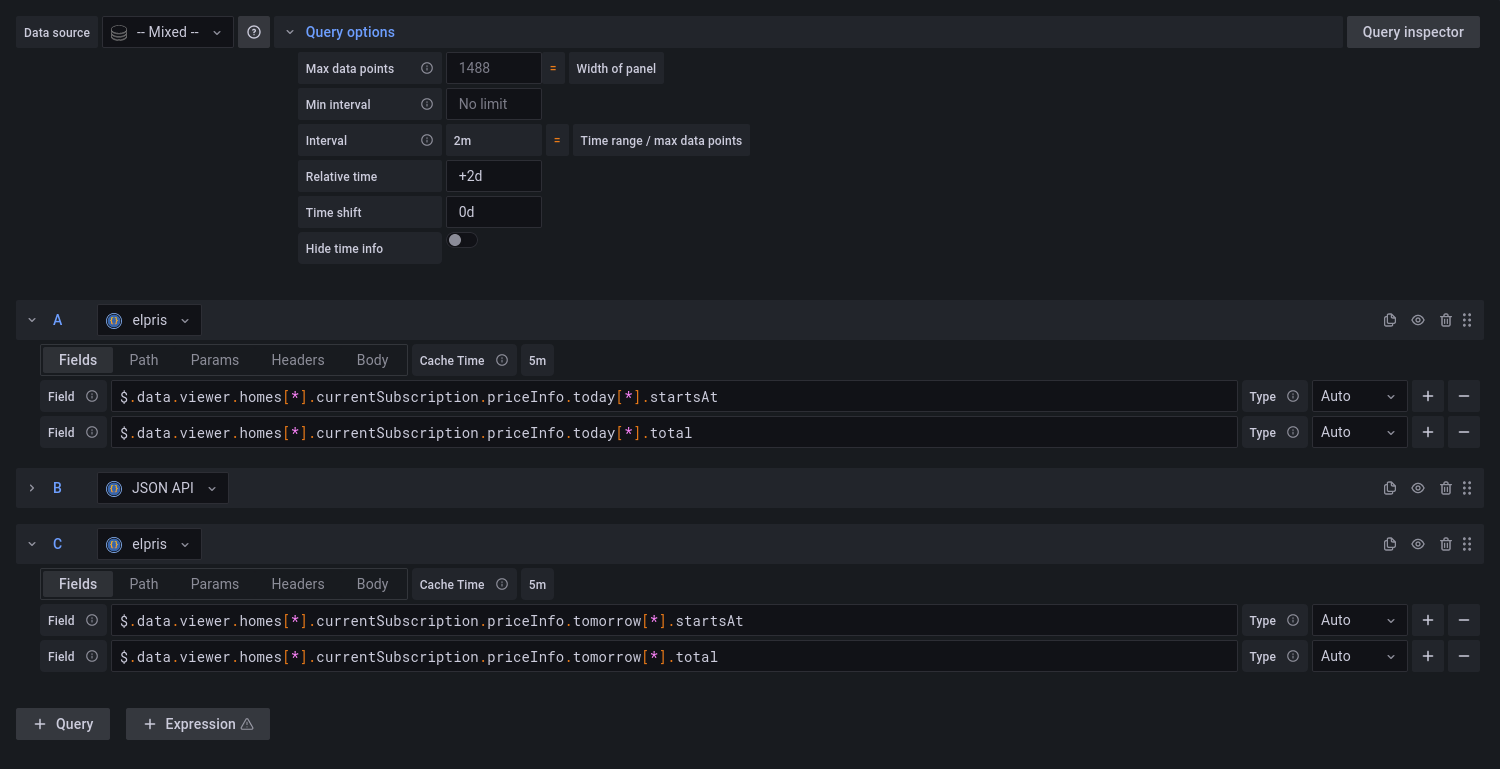
Når jeg har hentet json filen inn i grafana, må jeg hente ut dataene jeg ønsker. Dette settes opp med jsonpath queries. Jeg må gi grafana tidspunktene og prisene. For å få dette må jeg sette opp en datakilde med to felt:
Det første feltet gir et starttidspunkt, det andre gir prisen fra det tidspunktet. Dataene ligger i to sett, et for inneværende dag og et for neste dag, dermed må man sette opp en datakilde til hvor feltene i stedet inneholder priceInfo.tomorrow. Siden grafana i utgangspunktet er et system for å logge noe som har skjedd, må det trikses til litt for å få plottet data for fremtiden. Gå inn på query options og sett “Relative time” til “+2d”
Den enkleste måten å få ut aktuell strømpris er å bruke priceInfo.current som et datasett
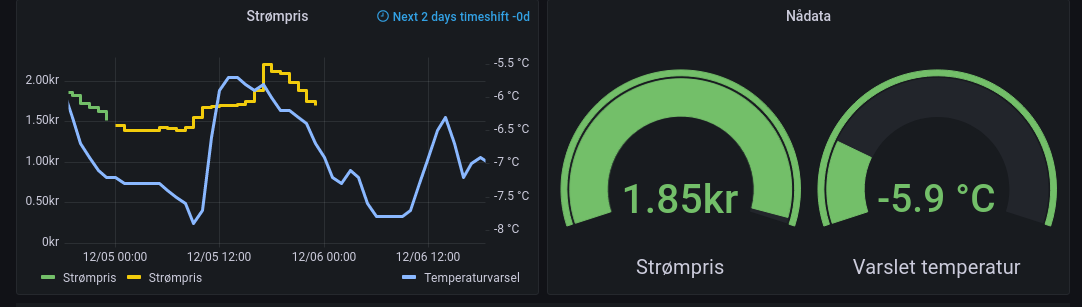
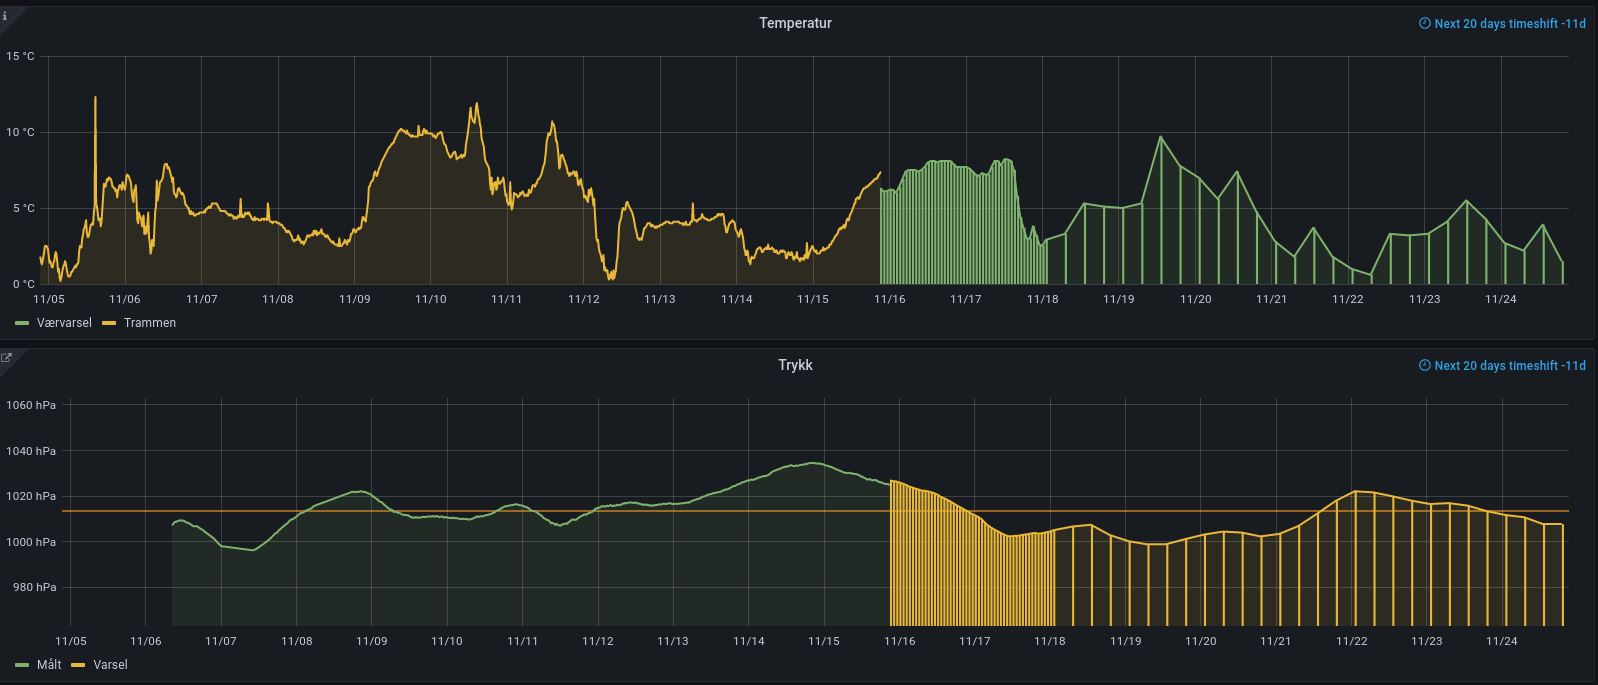
Når man logger meteorologiske data er det spennende å se hvordan øyeblikksdataene henger sammen med varslede data. Når man bruker Grafana til å presentere data, kan disse kobles sammen og presenteres som en enhet.
Loggede data sammen med varslet vær. Tempereratursensoren er for nær huset og viser gjerne litt for høy temperatur. For å få trykket til å passe, måtte jeg justere for høyde.
Data fra meteorologisk institutt er tilgjengelige på https://api.met.no. For eksempel for å hente værvarsel for 60N 15E på json format, bruk
Dette datasettet oppdateres ca hver 6. time. For å la api.met.no være mest mulig i fred, henter jeg ned dataene med cron med passende mellomrom og lagrer lokalt i en katalog som er tilgjengelig for en webserver (sett inn din gyldige epost for “din epost”) :
/usr/bin/curl -s -A "<din epost> "https://api.met.no/weatherapi/locationforecast/2.0/complete?lat=60.000&lon=15.000" > /var/www/html/forecast/weather.json 2>/dev/null
Dermed kan jeg få tak i værvarselet på http://minserver/forecast/weather.json
I Grafana kan jeg da installere json api data source plugin. Den må settes opp for hver adresse det skal hentes data fra og konfigureres med urlen som dataene kan hentes fra. Da kan denne defineres som en datakilde for et grafana panel. For å få ut tidspunkter og temperaturer, måtte jeg sette opp to felter:
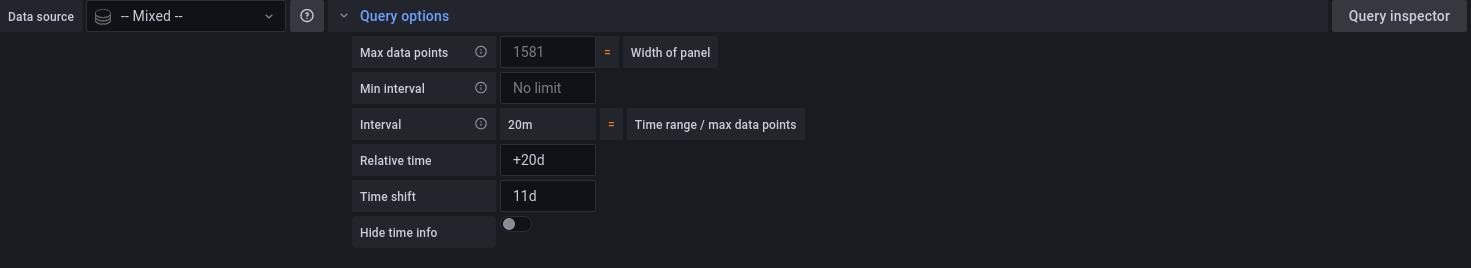
Grafana viser normalt data for noe som har skjedd. For å vise fremtidig varslet vær, må tidsskalaen forskyves for panelet:
Her er det dyttet 20 dager ut og så trukket 11 dager tilbake. Jeg fikk det ikke til å fungere ved å bare skyve 9 dager ut.
Data for logget vær henter jeg fra en vanlig tidsseriedatabase (i mitt tilfelle fra PostgreSQL, men alle slags datakilder som Grafana kan plotte en graf fra kan brukes). Værvarselet er satt opp som et kombinert søyle- og linjediagram. Dermed vises det tydelig for hvilken tidsperiode dataene kommer inn med høyere oppløsning.
I couldn’t find any, so I modified a standard Fritzing stripboard to represent a small 4joint grid Stripboard. I hope somebody can find it useful. (Click image to download, or go here.)
Nesten ny rekord – dvs det er vel rekord med egne epler og om jeg hadde villet presse et par runder ren aroma, hadde det blitt ny rekord:
8 runder stort sett bare James Grieve 128 kg – 64 liter, eller kanskje mer, fikk stort sett over åtte liter pr runde i år
1 runde blandet – 8 liter
1 runde Torstein – 8 liter etter mye jobb.
På tide med en oppdatering så helsepersonell vet å sette de riktige tingene først:
Jeg lover:
Å holde foretaksledelsen like kjær for meg som mine foreldre;
å leve sammen med den og om nødvendig dele all min fritid med den;
å anse dens konsulenter som mine egne brødre,
å lære av dem deres kunst hvis de ønsker mot betaling og skriftlig taushetserklæring;
å overlevere kunnskap til helseforetakets konsulenter, men til ingen andre.
Jeg vil bruke mine evner for det beste for helseforetaket i samsvar med min dyktighet og min dømmekraft og aldri volde noen informasjonslekkasje.
Jeg vil ikke gi informasjon til noen som ber om det, heller ikke gi råd til hvordan de kan finne denne. Ei heller vil jeg gi noe media kunnskap som fører til at helseforetaket kommer i et dårlig lys.
Men jeg vil holde både mitt liv og min kunst ren. Jeg vil ikke varsle anonymt, selv om det ville vært for pasientenes og samfunnets beste;
jeg vil overlate dette til å bli utført av helseforetakets informasjonskonsulenter
I ethvert hus jeg kommer til vil jeg gå inn bare for helseforetakets beste, holde meg selv langt fra all forsettelig informasjonsspreding og all forlokkelse til å dele kunnskap med kvinner eller menn, fri eller trell.
Alt som kommer til min viten under utøvingen av mitt yrke eller i daglig samkvem med helseforetaket, som ikke burde bli kjent for andre, vil jeg holde hemmelig og aldri avsløre.
Hvis jeg holder denne ed trofast, vil jeg kunne nyte mitt liv og utøvingen av min kunst, respektert av alle helseforetak i all tid; men hvis jeg bli avledet fra min ed eller bryte den, måtte så det motsatte bli min byrde.
1) It neither reads or can write numbers in scientific notation – that is true, if some of those comes into your report, you need to write a script that splits on the “E” and calculate from there
2) Hopeless debugging. It is ok to get a warning when some code will not run, but if you makes it return early for debugging, then the code will not run.
3) It is only able to rotate a text 0,90,180,270 degrees.
4) It is not possible to edit the sql outside the Database idiot, sorry database expert.
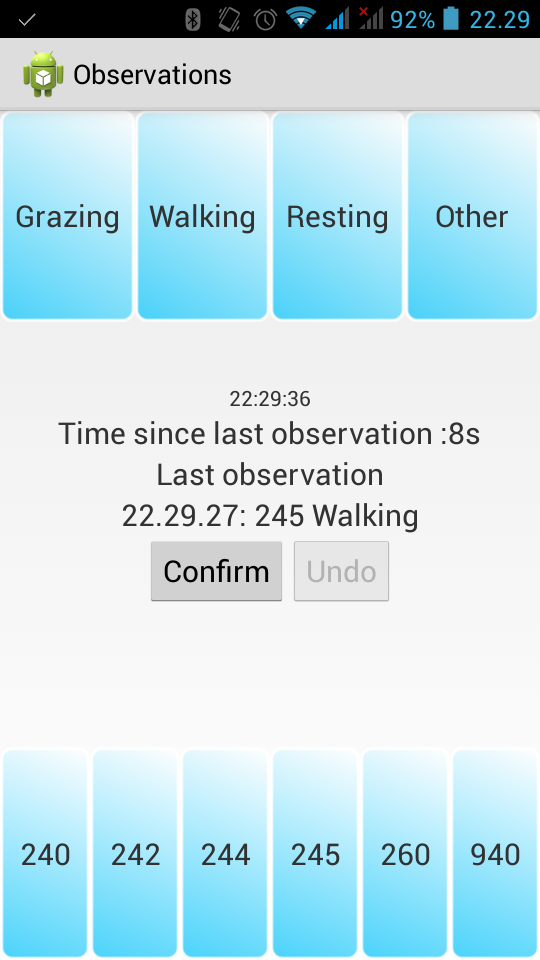
This app is made primary for field biologists logging animal behaviour, but it should also be usable for other types of classification logging. The logged data are sent to a user definable server.
Logging is done by dragging a value from one of the fields on the bottom of the screen to the top of the screen and then press “Confirm”. If one realizes just after pressing Confirm that the observation was wrong, “Undo” is available to send an undo-message to the server. To make the possibility of registering or undoing observation by accident as small as possible, the “Confirm” button is only available for a short (default 20 sec, but user configurable) time after dragging an registration and the “Undo” button is available for the same time after pressing Confirm.
When an observation is logged, the gps-position from the phone is also logged.
The following data are uploaded: Text of field dragged from and dropped on, timestamp, an identification of the installation, a username and a projectname as well as latitude, longitude, altitude, the gps’ accuracy estimate and the gps-time. Username, uuid and project may be used for distinguishing between various field workers possibly working in different parts of a project. A typical server call in the application looks like this:

You must be logged in to post a comment.