 (image: geeetech)
If connecting through a standard ribbon cable, the inner and outer pins are switched so that 1 <-> 2 etc.
| name | pin rf24 |
pin uno |
|---|---|---|
| Vcc | 1 | 3.3V |
| Gnd | 2 | gnd |
| CSN | 3 | D7 |
| CE | 4 | D8 |
| MOSI | 5 | D11 |
| SCK | 6 | D13 |
| IRQ | 7 | n.c. |
| MISO | 8 | D12 |
(image: geeetech)
If connecting through a standard ribbon cable, the inner and outer pins are switched so that 1 <-> 2 etc.
| name | pin rf24 |
pin uno |
|---|---|---|
| Vcc | 1 | 3.3V |
| Gnd | 2 | gnd |
| CSN | 3 | D7 |
| CE | 4 | D8 |
| MOSI | 5 | D11 |
| SCK | 6 | D13 |
| IRQ | 7 | n.c. |
| MISO | 8 | D12 |
Dnb vil ta sin del av julehandelen og sender ut gode tilbud:
“Nå kan du øke kreditten med 30 000 kroner på kortet ditt
Enkelte måneder er mer krevende økonomisk enn andre, og da er det praktisk med en fleksibel kreditt. Nå gir vi deg mulighet til å øke kredittbeløpet.
Du vil automatisk øke kredittrammen din med 30 000 kroner på ditt Leve MasterCard om du takker ja til dette tilbudet. Tilbudet er gyldig til 6.desember 2013.
Husk at du med Leve MasterCard kan få saldo via SMS eller kontofon på 04800. SMS-tjenester kan du sette opp her i nettbanken.
Priseksempel Leve Mastercard
Nom.rente 18,60 % / eff.rente 27,26%, 15 000 kroner o/12 måneder. Totalt 16 819 kroner. Prisen er per 01.01.13 og kan endres.
Ja takk, jeg vil øke kredittrammen med 30 000 kroner på mitt Leve MasterCard ”
Det er jo interessant at det eneste svaralternativet er “Ja takk” – “Jeg kjenner min økonomi og kunne ikke drømme om å potensielt øke kredittkortgjelden” er ikke noe alternativ. Dnb kjenner nok min økonomi vel så godt som jeg gjør selv og de vet at de gangene jeg har av forskjellige mer eller mindre gode grunner har makset ut kredittkortet har jeg brukt lang tid på å betale tilbake. Men selvfølgelig, det er jo glimrende for dem – ikke noe er bedre enn å kunne skrape inn fra kundene med 27.26% effektiv rente.
En av verdens kjedeligste bloggposter, men jeg liker å ha oversikt…
2025: Totalt 336 kg epler som har blitt til 171 liter juice, hvorav 38 liter blir til cider.
2021: ca 80 liter juice + 60 liter cider. ca 40% epler fra nr 6, ca 30% Torstein fra Høyenhall og resten egne
2014 : 80 liter
2014 : 30 liter (ca halvparten av eplene fra andre)
2013 : 69 liter
2012 : 30 liter
2011 : 57 liter
2010 : 50 liter
2009 : 38 liter
2008 : 88 liter (mye epler fra naboer)
2007 : 12 liter
2006 : 83 liter
GeoJSON is a text format for encoding various geographical structures. I have a large number of point data with various extra information stored in a postgresql data base. I fetch all the data into an array in php, using PDO::FETCH_ASSOC, that is each row that has been fetched is an item in a numerical array, for each row, the various fields are coded as an associative array, so I have a structure like
Array
(
    [0] => Array
        (
            [id] => 210
            [name] => Sellafield
            [lat] => 54.43
            [lon] => -3.52
            [type] => Reprocessing plant
            [country] => Great Britain
        )

    [1] => Array
        (
            [id] => 177
            [name] => Dounreay
            [lat] => 58.57
            [lon] => -3.73
            [type] => Reprocessing plant
            [country] => Great Britain
        )
)
Now I want to use the lat and lon field to create the coordinate fields in GeoJSON and store the rest of the information as properties. Having the dataset stored as $dataset, I run the following code
$minlat=100;
$maxlat=-100;
$minlon=400;
$maxlon=-200;
foreach($dataset as &$item){ # Uses a pointer to refer to $item, so that changes are reflected in $dataset
   $item['geometry']['type']='Point';
   # Must make sure the coordinates are stored as numbers, not strings
   $lon=$item['lon']*1;
   $lat=$item['lat']*1;
   $item['geometry']['coordinates']=array($lon,$lat);
   $minlon=min($minlon,$lon);
   $maxlon=max($maxlon,$lon);
   $minlat=min($minlat,$lat);
   $maxlat=max($maxlat,$lat);
   unset($item['lat']);
   unset($item['lon']);
   foreach($item as $k=>$v){
      # Don't want to mess with geometry as it is already set
      # Id should also be set directly.
      if(!($k='geometry' || $k=='id')) {
         # Must make sure that numeric values are correctly handled
         if(is_numeric($v)?$v*1:$v;
         $props[$k]=$v;
         unset($item[$k]);
      }
    }
    $item['type']='Feature';
    $item['properties']=$props;
  }
  $dataset=array("type"=>"FeatureCollection","features"=>$dataset);
  $dataset['bbox']=array($minlon,$minlat,$maxlon,$maxlat);
  # Defining crs for WGS84 lat/lon
  $dataset['crs']=array("type"=>"name","properties"=>array("name","urn:ogc:def:crs:EPSG::4326"));
$json=json_encode($dataset);
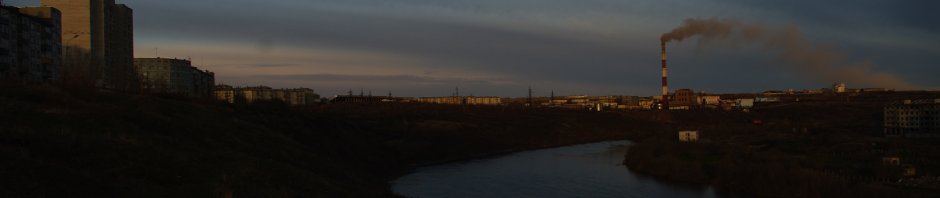
Eplepressingen er i gang igjen, nå med nyinnkjøpt kvern
13. oktober
12+16 kg james grieve presset til 15 liter juice
27 oktober
32 kg James Grieve presset til 19 liter juice
8 kg James Grieve + 8 kg torstein 9 liter juice,
17 kg torstein (veiefeil) presset til 9 liter juice.
9.november
Siste rest av Torstein + noen andre rester:
16 kg torstein ble snaut 8 liter juice
16 kg torstein + lagret aroma, snaut 9liter juice
Avslutter årets sesong med 69 liter juice fra 127 kg epler. Lagrer ca 20 kg til Mye stort, spesielt på aroma og torsten. En god sesong!
Helt klart dårligere utbytte fra torstein enn fra james grieve. Fant også ut at pakker på 5 kg er i meste laget for pressen. Regner med å ta en eller to runder med torstein senere, muligen også en runde med aroma som ble plukket for et par uker siden.
Årets oppgradering i eplepresseriet er en fruktkvern. til erstatning for tidligere bruk av en vanlig kjøkkenmaskin
Eplepresseriet
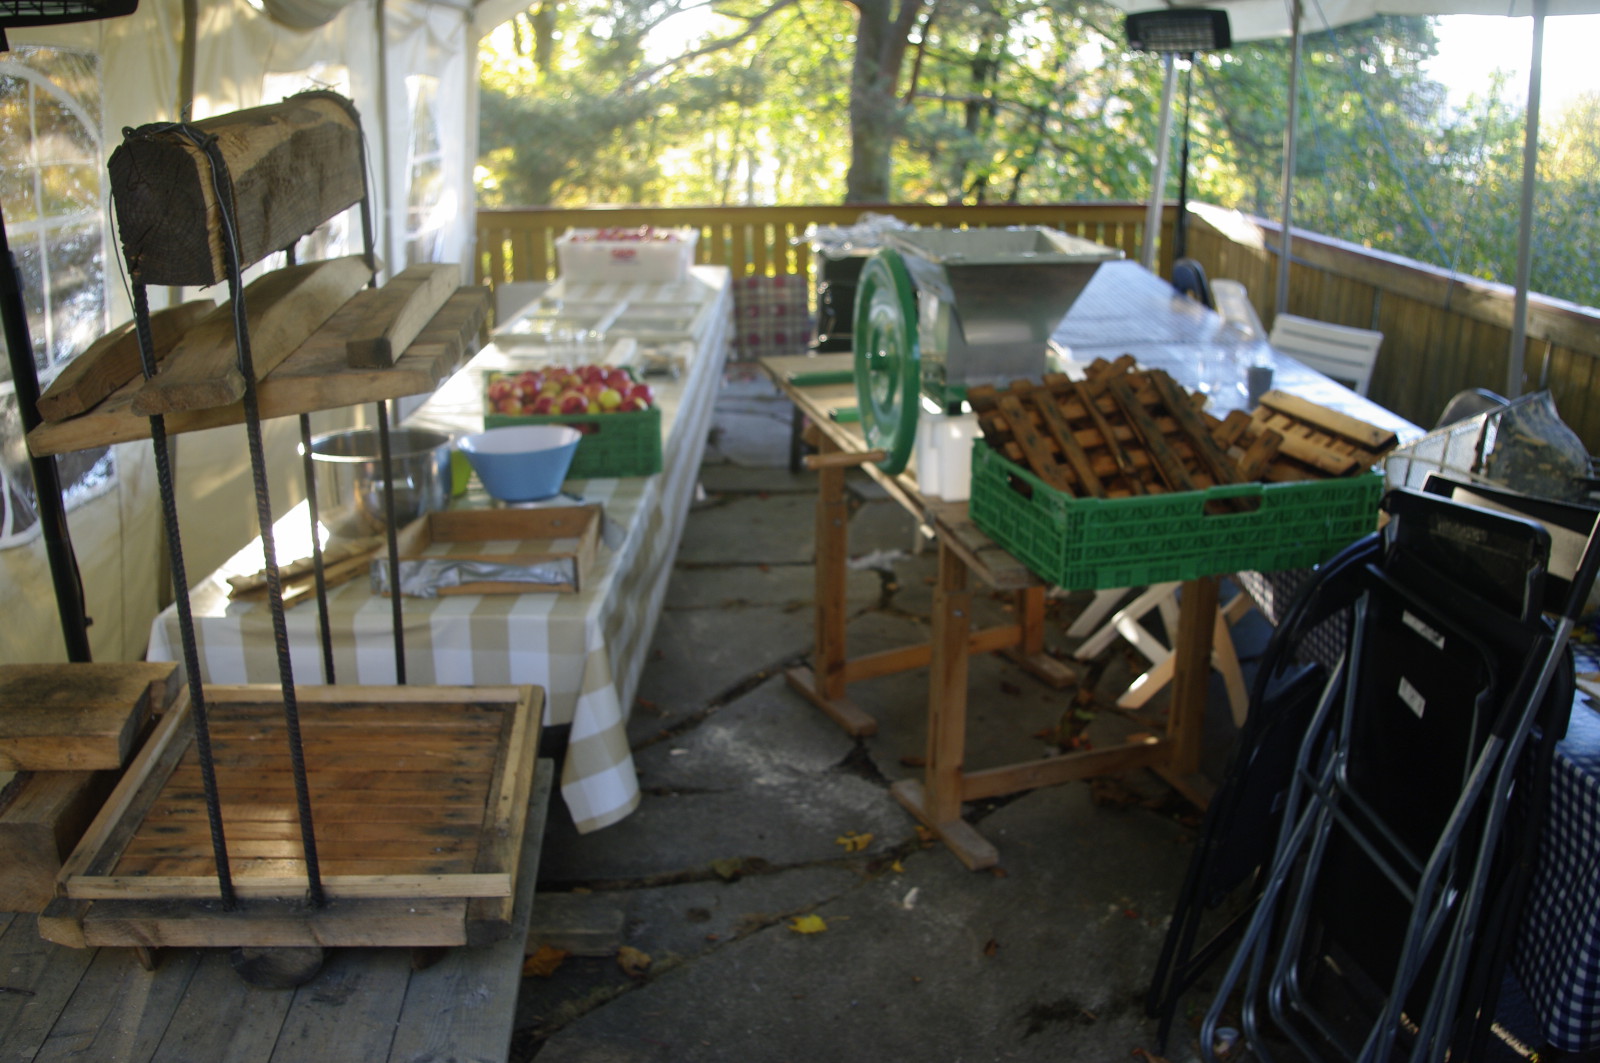
Eplekverna har kniver som kutter eplene og drar dem inn mellom valser som knuser dem.
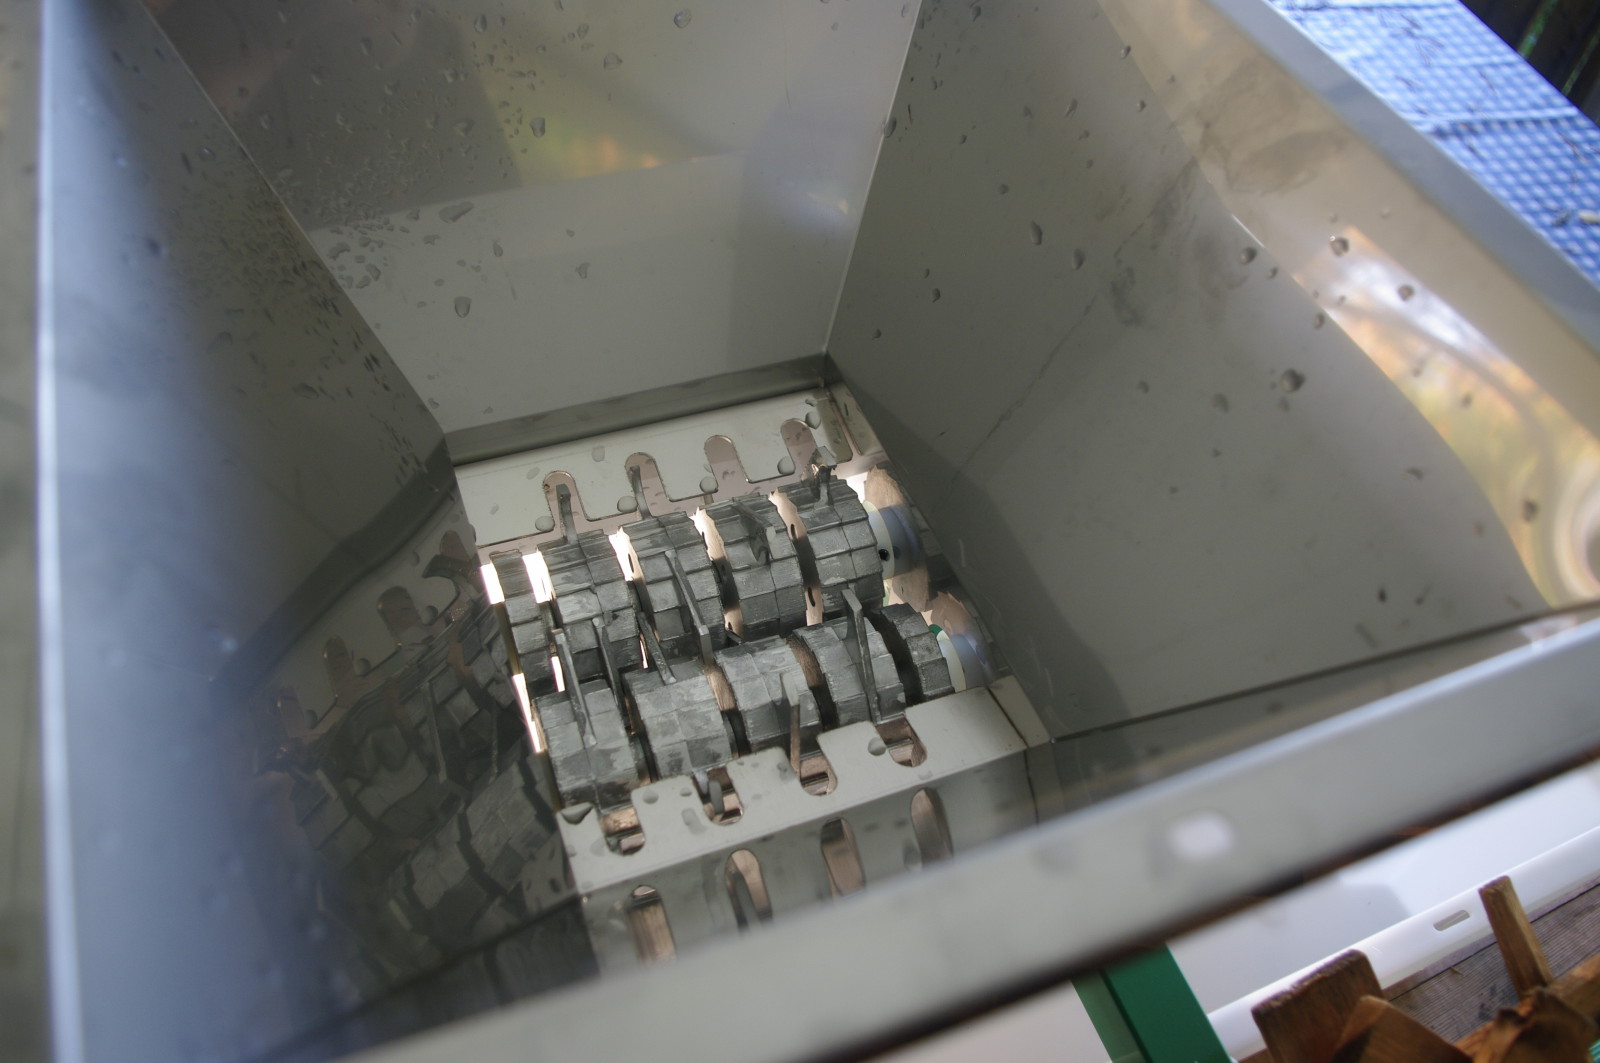
4 kg epler klar for kverning.
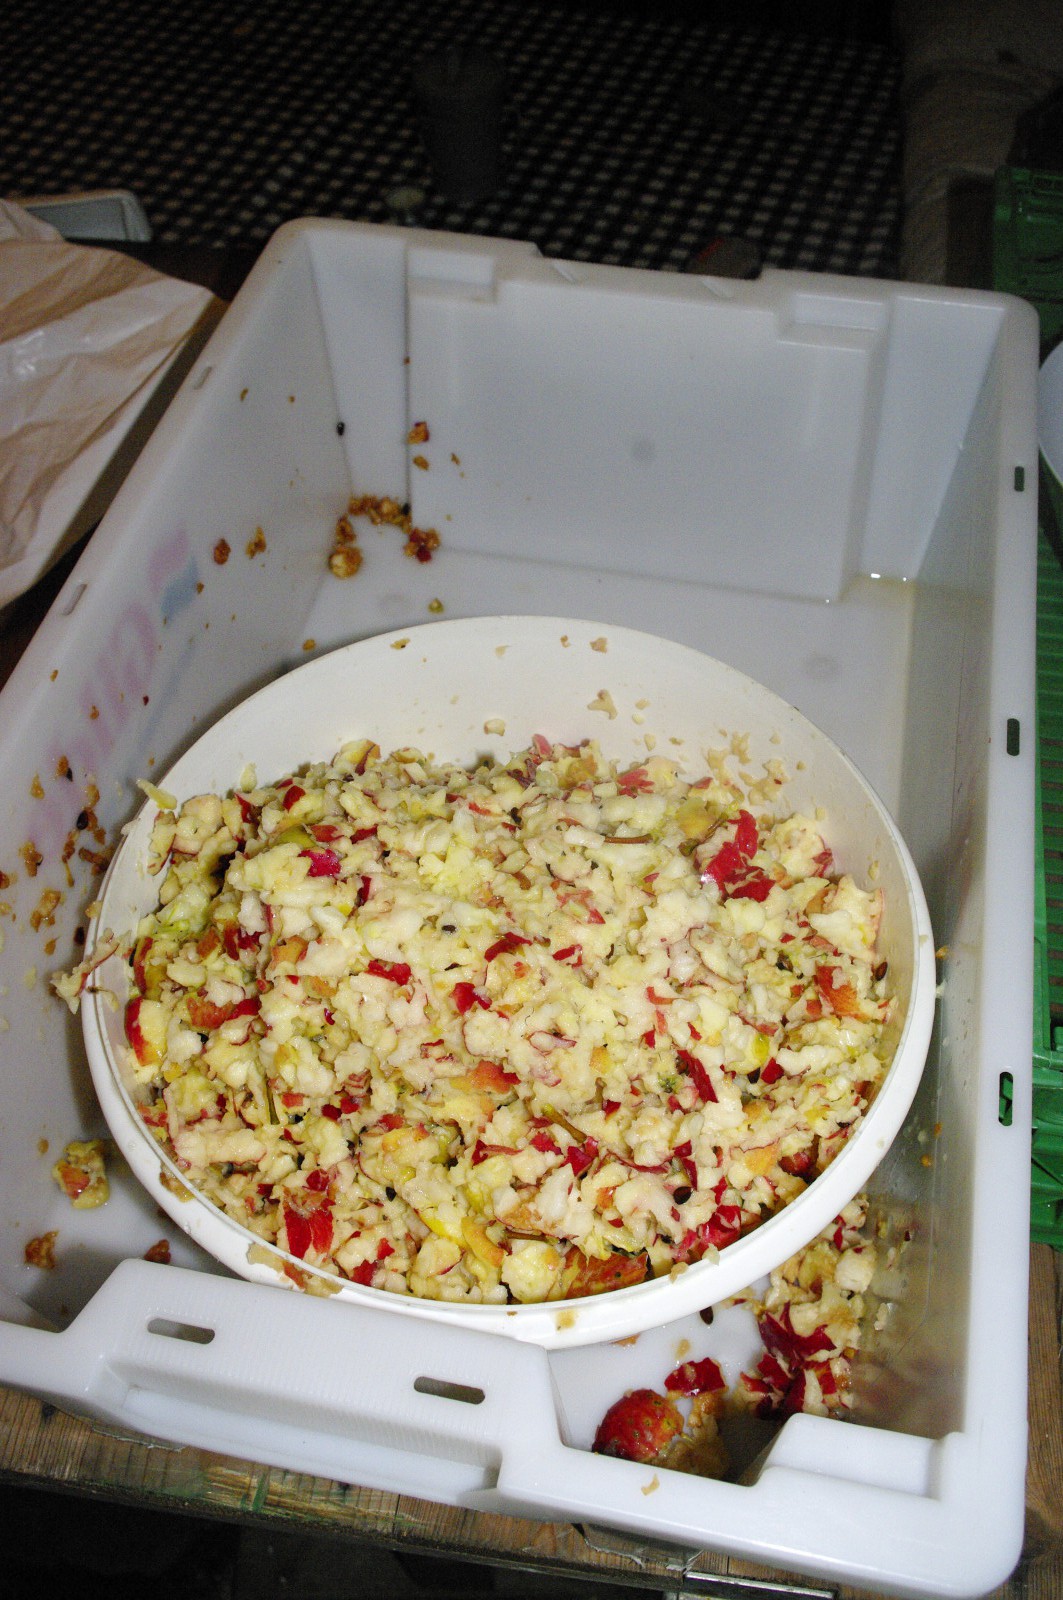
Kvernet fruktmasse. Den blir grovere enn ved bruk av kjøkkenmaskin, men det ser ut for å være en fordel ved pressingen
Etter to runder med pressing må det sies at dette var en svært god investering. Jeg plasserte kvernen oppå en plastkasse og satt en stor (ca 6 l) plastbolle nedi for å ta imot de oppmalte eplene.
Not the most well-documented module I’ve ever seen…
To make it connect to your database of choise, in the app-settings, feed in
PSYCOPG2_DATABASE_URI=”pgsql://dbuser:dbpassword@dbhost/database”
e.g.
PSYCOPG2_DATABASE_URI=”pgsql://postgres:Secr1tPsswrd@localhost/postgres”
Come on, make my coffee!

This coffee is strong enough to defend itself
Gymtimene på 80-tallet var for de sterke og minnene kommer strømmende på.
Gymlæreren min i 2. og 3. vgs hadde stor tro på at langdistanseløp var det eneste saliggjørende. Ut for 5000m på Bislett. Han sto på kanten og sekunderte. “14 etter 45:50” ropte han da jeg luntet forbi. “Hæ” svarte jeg, da jeg ikke hadde filla anelse om hva han mente (som jo tradisjonen var i gymtimer skal jo ikke noe forklares og jeg forsto ikke sekunderingen hans før mange år senere). Etter noen flere runder falt jeg ut av skjemaet hans. Jeg drev det også relativt langt til skulking i gymtimene etter at jeg hadde en skade å unnskylde det på. Jeg og en kompis kom oss helt til Tøyenbadet en gang vi hadde svømming, men endte opp i kafeen… “Hva om
Heldigvis var jeg alltid mest selvironisk i forhold til mine ytelser i gymtimene – men det var vel ikke det som var meningen med det hele?
Maps with R – part III shows how to make an active svg-map from R. In that example, a specialiced data set was used. I have redone it by using a map pulled in from postgis and also added on some more functionallity, some of it may be extened further to make a kind of client-based web-gis application. This examnple map uses a continous color scale for a map of discrete values. This is a bad idea, but is used here to simplify the example.
Moving the mouse pointer over the map shows a tooltip with some selected information for each polygon. When clicking on a polygon, the color changes and a callback to the web pages makes the web page show the ID of the polygon. This can of cource be used to show more information, possibly fetched through an ajax call.
The svg-map is prepared through R. A number of pakages must be loaded:
library(gridSVG)

library(sp)

library(lattice)

library(latticeExtra)

library(maptools)

library(colorspace)
I have a variable called “map” that is a map pulled in from a postgres database.
map=readOGR("PG:dbname=database user=username password=password",layer=<name of the table in postgis>)
Some parts must be prepared before the svg-export can be run:
 grid.newpage()

  set_Polypath(FALSE)

  panel.str < - deparse(panel.polygonsplot, width=500)
  panel.str <- sub("grid.polygon\\((.*)\\)","grid.polygon(\\1, name=paste('ID', slot(map, 'data'\\)\\$gid\\[i\\], sep=':'))", panel.str)
  panel.polygonNames <- eval(parse(text=panel.str),envir=environment(panel.polygonsplot))
  p <- spplot(map["category"], panel=panel.polygonNames)
  eval(p)
  set_Polypath(TRUE)
For other use, two lines must/ may be altered:
panel.str < - sub("grid.polygon\\((.*)\\)","grid.polygon(\\1, name=paste('ID', slot(map, 'data'\\)\\ $gid\\[i\\], sep=':'))", panel.str)
map is the name of the variable in which the map is stored.
gid is the name of the polygon id.
This lines makes an ID of each polygon that is made as "ID:" and the value of gid for each polygon.
p < - spplot(map["category"], panel=panel.polygonNames)
Again, map is the variable holding the map, category is the variable I want to be used for coloring the map.
Thereafter, the graphical objects (grobs) that we want to work on has to be enumerated:
## grobs in the graphical output

grobs < - grid.ls()
## only interested in those with "ID:" in the name
nms <- grobs$name[grobs$type == "grobListing"]
idxNames <- grep('ID:', nms)
IDs <- nms[idxNames]
for (id in unique(IDs)){

  # Need to get back the gid-value

  x < - unlist(strsplit(id, 'ID:'))
  i=as.numeric(x[2])
  # Looks up the map element with the corresponding gid
  n=which(map$gid==i)
  # Picks out values of category and shape_area for making the tooltip
  info=paste(id,"->",map$category[n],'(',map$shape_area[n],'m2 )')

  g < - grid.get(id)
  ## attach SVG attributes
  # Defines attributes for the respective polygons. the javascript functions is defined in "tooltips.js" (see below)
  grid.garnish(id,
               onmouseover=paste("showTooltip(evt, '",info,"')"),
               onmouseout="hideTooltip()",
               onclick="mark(evt)",
               class=paste('cc',map$categorycode[n],sep=''),
               name=info)
}
# The file containing the javascript functions
grid.script(filename="tooltip.js")

svgname="svgtest.svg"
gridToSVG(svgname)
This will produce the svg-file svgtest.svg and a very simple (too simple) html-file, svgtest.svg.html. The file tooltip.js must be available in the same directry as the svg.
The function mark(evt) is calling
parent.showalert(txt);
The parent object is the webpage that contains the svg-file, so the showalert(txt) function must be defined in that page. In this case, it is as simple as function showalert(txt){
document.getElementById('Showinfo').innerHTML=txt;
}
The page is available at http://sickel.net/misc/Geilo_annomap.svg.html
Possible further development:
* Click on an item in the legend to get all items of that class marked (they are already set to the same class)
* Fetch more information from a backend server when clicking (or for the tooltip)
* Change the color coding of the map (eg by fetching information from the backend
If this is to be run under R v 2.x, (e.g. on an older Ubuntu LTS) the available packages is lacking two functions, they may be provided through the following stubs:
grobDescent< -function(x=0,y=0,z=0){
 return(unit(1,"npc"))
}
grobAscent<-function(x=0,y=0,z=0){
 return(unit(1,"npc"))
}
You must be logged in to post a comment.