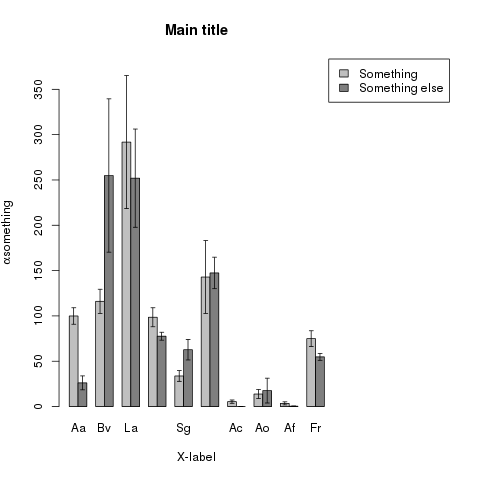
I have not found any simple way to make a barplot with error-bars in R, so I had to write a script for it:
errorbarplot< -function(data,error,ylab,xlab,main){
  palette(c('gray75','grey50','grey25','white'))
  mar=par()$mar
  par(xpd=T, mar=par()$mar+c(0,0,0,8)) # Makes a bit space to place the legend
  maxy=max(data+error)*1.05            # Space enough for the max error + some space
  bp<-barplot(data,beside=TRUE,ylab=ylab,xlab=xlab,main=main,ylim=c(0,maxy),col=c(1,2))
  segments(bp,data-error,bp,data+error) # Draws the vertical lines in the error plot
  ew=(bp[2,1]-bp[1,1])/2                # Sets the width of the error bars as half the bare
  ew=ew/2
  segments(bp-ew,data-error,bp+ew,data-error)
  segments(bp-ew,data+error,bp+ew,data+error)
  legend(max(bp)+1,maxy,rownames(data),fill=c(1,2))
  par(mar=mar)                           # Resets the width of the plotmargins.
}
This is called with a data set like: (It may of cource be produced other ways, just as long as you end up with one data matrix and one error-matrix)
rn=c('Aa','Bv','La','Pap','Sg','Vm','Ac','Ao','Af','Fr')
li=c(99.9,116.1,291.8,98.5,33.7,142.9,5.4,13.8,3.5,74.9)
sh=c(26.1,254.9,252,77.6,62.7,147.4,0,17.6,0.4,54.8)
seli=c(9.1,13.3,73.4,10.5,5.9,40.2,1.8,5,1.7,8.7)
sesh=c(7.7,84.6,54.2,4.4,11.3,17.4,0,13.7,0.2,3.8)


dimnames=list(c('Something','Something else'),rn)
data=matrix(c(li,sh),nrow=2,byrow=TRUE,dimnames=dimnames)
error=matrix(c(seli,sesh),nrow=2,byrow=TRUE,dimnames=dimnames)
ylab=expression(paste(alpha,'something'))
main='Main title'
xlab='X-label'
errorbarplot(data,error,ylab,xlab,main)


You must be logged in to post a comment.